

Common menu bar links
ARCHIVED - Canada Border Services Agency
Quarterly Financial Report
For the quarter ended December 31, 2011
 This page has been archived.
Archived Content
Information identified as archived is provided for reference, research or recordkeeping purposes. It is not subject to the Government of Canada Web Standards and has not been altered or updated since it was archived. Please contact us to request a format other than those available.
Statement outlining results, risks and significant changes in operations, personnel and programs
Introduction
This quarterly report has been prepared by management as required by section 65.1 of the Financial Administration Act and in the form and manner prescribed by the Treasury Board. This quarterly report should be read in conjunction with the Main Estimates, Supplementary Estimates, and previous Quarterly Financial Reports for the current year.
A summary description of the Canada Border Services Agency (CBSA) program activities can be found in Part II of the Main Estimates.
Basis of presentation
This quarterly report has been prepared by management using an expenditure basis of accounting. The accompanying Statement of Authorities includes the CBSA's spending authorities granted by Parliament and those used by the department, consistent with the Main Estimates and Supplementary Estimates for the 2011–2012 fiscal year. This quarterly report has been prepared using a special purpose financial reporting framework designed to meet financial information needs with respect to the use of spending authorities.
The authority of Parliament is required before moneys can be spent by the Government. Approvals are given in the form of annually approved limits through appropriation acts or through legislation in the form of statutory spending authority for specific purposes.
When Parliament is dissolved for the purposes of a general election, section 30 of the Financial Administration Act authorizes the Governor General, under certain conditions, to issue a special warrant authorizing the Government to withdraw funds from the Consolidated Revenue Fund. A special warrant is deemed to be an appropriation for the fiscal year in which it is issued.
As part of the departmental performance reporting process, the CBSA prepares its annual departmental financial statements on a full accrual basis in accordance with Treasury Board accounting policies, which are based on Canadian Generally Accepted Accounting Principles for the public sector. However, the spending authorities voted by Parliament remain on an expenditure basis.
The quarterly report has not been subjected to an external audit or review.
Highlights of fiscal quarter and fiscal year to date (YTD) results
This section highlights the significant items that contributed to the net increase in resources available for the year and actual expenditures for the quarter ended December 31, 2011.
Graph 1:
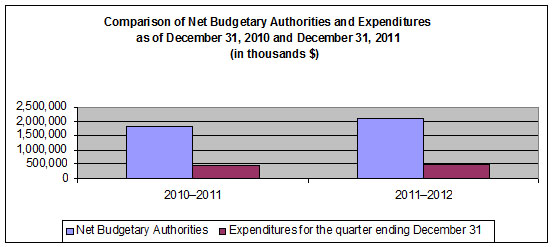
Significant changes to authorities
As at December 31, 2011, the total authorities available for the year have increased by $285.1 million from $1,830.5 million in 2010–2011 to $2,115.6 million, compared to the same quarter of the previous year. This net increase is mainly attributable to Vote 10 – Operating Expenditures of $210.4 million and to Vote 15 – Capital Expenditures of $57.4 million.
Increase in Vote 10 consisted primarily of:
- A $130.0 million Economic and fiscal statement realignment between fiscal years;
- A $50.3 million increase in paylist expenditures for such items as maternity benefits and severance settlement payments; and
- Improvements in CBSA's program integrity, and the implementation of Bill C-51 – the Refugee Protection Act, which were offset by Strategic Review and cost containment measure cuts.
Additionally, the CBSA received an increase in carry-forward funding of $20.6 million from $178.5 million in 2011–2012 compared to $157.9 million in 2010–2011. The net increase in carry-forward funding was primarily related to Vote 15.
Explanations of significant variances in expenditures from previous year
In comparing the third quarter year-over year expenditures there is an increase of $60.7 million, from $432.9 million to $493.6 million. This represents an increase of 14% against expenditures recorded in quarter three last year. The increase in expenditures is mainly due to spending in Personnel, Professional and special services, and Acquisition of land, buildings and works.
Personnel expenditures have increased by $39.5 million from $307.2 million to $346.7 million compared to the same period in the previous fiscal year. This increase of 12.9% is composed mainly of the severance settlements payments in the amount of $28.9M, in addition to the salary increases from collective agreement renegotiations, and annual salary increments.
Professional and special services expenditures increased by $19.5 million from $79.8 million to $99.3 million compared to the same quarter in the last fiscal year. This increase of 24.4% is composed mainly of $7.2 million spent on technology for the eManifest initiative, $6.4 million spent for the Data Centre Recovery Project, $3.9 million for Shared Services, as well as a $2.0 million increase of welfare and/or detention facility centre costs due to the aftermath of MV Sunsea.
Acquisition of land, buildings and works has increased by $8.8 million from $12.5 million to $21.3 million compared to the same quarter in the previous fiscal year. This increase of 70.4% is composed mainly of $10.2 million spent on the construction of infrastructure for arming of the CBSA border service officers, $5.9 million due to the construction costs incurred in building new ports of entry, and a reduction of $4.0 million in expenditures incurred for the Doubling-up initiative.
Risks and uncertainties
The CBSA is currently facing a number of pressures against its authorities irrespective of future savings likely to result from the Deficit Reduction Action Plan (DRAP) exercise. It is expected that future year budgets will be reduced commencing in 2012–2013. However, at this time, the nature and extent of any reductions are still not known.
As well, Budget 2010 Cost Containments Measures will require the CBSA to finance, on a permanent basis, the costs of wage increases resulting from current and future collective agreements negotiated between 2010–2011 and 2012–2013. The ongoing impact of the Budget 2010 Cost Containment Measure is a reduction to base funding which limits the ability to deliver on other programs and expected results.
In recognition of this tightening fiscal environment, the CBSA has taken a more rigorous approach to the management of revenues, expenditures, forecasting and commitment monitoring. These steps began in mid fiscal year 2009–2010 to address the rapidly changing economic climate. The Agency has introduced more comprehensive monthly analyses of trends and forecasts of employee headcount, salary and non-salary expenditures to ensure affordability and sustainability. These measures, along with other budgetary restrictions have been put in place to mitigate the impact of the operating freeze.
The Agency has also been ensuring that integration exists between investment plans, business plans and that risks and complexities be considered when new business initiatives are proposed within the context of these plans.
Aside from funding risks and uncertainties, the CBSA also conducts risk assessments on all aspects of its business. The following are risks that the CBSA has identified through its Enterprise Risk Assessment process that may have significant potential financial impacts:
Internal risks and uncertainties:
- Human resources – the risk of not being able to recruit, retain, and/or develop qualified individuals.
- Information management – the risk of not being able to effectively capture organize, disseminate, and/or dispose of information.
- IT systems – the risk of not having adequate support to address program requirements.
External risks and uncertainties:
- Irregular migration – the risk of being unable to prevent and/or intercept irregular migration and/or migrants.
- Legal – the risk of legal challenges.
- Revenue – the risk of not adequately collecting revenues on behalf of the Government of Canada.
- Economy – the fluctuation in global economic climate could impact the volume of people and goods entering Canada.
At this time, the CBSA has completed the identification of risks by evaluating the Agency's exposure based on likelihood and impact and is in the process of completing the development of mitigation strategies. These mitigation strategies will be provided in future quarterly financial statements once they have been approved by the appropriate authorities.
Significant changes in relation to operations, personnel and programs
There have been no significant changes to key personnel over the quarter.
On August 4, 2011, Shared Services Canada (SSC) was created by an Order in Council (OIC) under the Financial Administration Act in order to adopt an enterprise-wide, stream-lined approach to Information Technology. The CBSA will be required to identify amounts of authorities by vote that relate to functions transferred to SSC. Amounts for future years will be addressed in the 2012-13 Annual Reference Level Updates and subsequent Supplementary Estimates. Appropriations will be required to be transferred from the CBSA to SSC pursuant to Section 31.1 of the Financial Administration Act.
Approval by Senior Officials
Approved by:
President
Chief Financial Office
Ottawa, Canada
February 13, 2012
Canada Border Services (Agency Activities)
Quarterly Financial Report
For the quarter ended December 31, 2011
Table 1: Statement of Authorities (Unaudited)
| Fiscal Year 2011–2012 | Fiscal Year 2010–2011 | ||||||
|---|---|---|---|---|---|---|---|
| (in thousands of dollars) | Total available for use for the year ending March 31, 2012* | Used during the quarter ended December 31, 2011 | Year-to-date used at quarter end | Total available for use for the year ending March 31, 2011* | Used during the quarter ended December 31, 2010 | Year-to-date used at quarter end | |
| Vote 10 - Net Operating Expenditures | 1,696,053 | 412,677 | 1,110,703 | 1,485,606 | 373,740 | 1,042,957 | |
| Vote 15 - Capital Expenditures | 238,671 | 35,671 | 68,599 | 181,238 | 18,100 | 27,357 | |
| Budgetary statutory authorities | |||||||
| Employee benefit plans | 180,893 | 45,223 | 135,670 | 163,702 | 40,926 | 122,777 | |
| Other | 64 | 183 | 117 | 255 | |||
| Total budgetary authorities | 2,115,617 | 493,635 | 1,315,155 | 1,830,546 | 432,883 | 1,193,346 | |
* Includes authorities available for use and granted by Parliament at quarter-end
Canada Border Services (Agency Activities)
Quarterly Financial Report
For the quarter ended December 31, 2011
Table 2: Departmental Budgetary Expenditures by Standard Object (Unaudited)
| Fiscal Year 2011–2012 | Fiscal Year 2010–2011 | ||||||
|---|---|---|---|---|---|---|---|
| (in thousands of dollars) | Planned expenditures for the year ending March 31, 2012* | Expended during the quarter ended December 31, 2011 | Year-to-date used at quarter end | Planned expenditures for the year ending March 31, 2011* | Expended during the quarter ended December 31, 2010 | Year-to-date used at quarter end | |
| Expenditures | |||||||
| Personnel | 1,382,696 | 346,685 | 971,829 | 1,247,672 | 307,168 | 905,879 | |
| Transportation and communications | 88,719 | 14,778 | 39,340 | 86,770 | 14,360 | 36,355 | |
| Information | 3,295 | 230 | 729 | 2,530 | 400 | 688 | |
| Professional and special services | 444,781 | 99,314 | 229,253 | 320,303 | 79,787 | 190,718 | |
| Rentals | 11,852 | 1,766 | 5,440 | 6,590 | 1,746 | 4,856 | |
| Repair and maintenance | 36,033 | 4,960 | 10,373 | 24,014 | 4,049 | 9,869 | |
| Utilities, materials and supplies | 39,138 | 4,310 | 11,172 | 25,534 | 4,454 | 10,502 | |
| Acquisition of land, buildings and works | 92,171 | 21,293 | 43,271 | 94,368 | 12,548 | 21,143 | |
| Acquisition of machinery and equipment | 31,201 | 3,421 | 7,297 | 37,407 | 2,866 | 9,215 | |
| Transfer payments | -20,519 | 0 | 0 | 0 | 0 | 0 | |
| Other subsidies and payments | 15,960 | 3,092 | 3,955 | 3,068 | 5,471 | 7,864 | |
| Total gross budgetary expenditures | 2,125,327 | 499,849 | 1,322,659 | 1,848,256 | 432,849 | 1,197,089 | |
| Less revenues netted against expenditures | |||||||
| Sales of Services | 9,710 | 6,234 | 7,582 | 17,710 | 0 | 3,777 | |
| Other Revenue | 0 | -20 | -78 | 0 | -34 | -34 | |
| Total revenues netted against expenditures | 9,710 | 6,214 | 7,504 | 17,710 | -34 | 3,743 | |
| Total net budgetary expenditures | 2,115,617 | 493,635 | 1,315,155 | 1,830,546 | 432,883 | 1,193,346 | |
